|
Introduction Humic substances (HS) are a class of compounds derived from biochemical decomposition of organic matter [1]. They have a backbone of aromatic nuclei and alkyl chains with a diversity of functional groups, notably carboxyl, phenol, hydroxyl, and quinone groups [2]. HS are ubiquitous in surface water, soil and sediments, and are of paramount importance in sustaining plant growth [3]. HS are responsible for the structure and physico-chemical properties of soil and are involved in most processes taking place at soil/water interphase [4]. Moreover, HS are a large fraction of the organic matter in compost, a soil amendment obtained by biological aerobic processing of organic wastes [5]. Humic acids (HA) are the fraction of HS soluble in water at neutral and basic pH. HA interactions with inorganic and organic pollutants have been intensively studied for several decades [6-13]. HA can reversibly bind cations by means of electrostatic interactions, as well as non-ionic compounds including organic pollutants by hydrogen bonds, dipole interactions and hydrophobic effects [14,15]. Dissolved HA are the main carriers of pollutants in water [16]. In addition, HA can strongly influence the retention of pollutants in soil and their bioavailability [17-19]. Because of the occurrence of large void spaces in their three-dimensional structure, HA are able to sequester organic compounds [20]. Thanks to this property, HA are a valid alternative to conventional adsorbent materials [21,22] for low-cost wastewater purification. HA may undergo conformational changes upon adsorption to solid surfaces [23] and exhibit a colloidal behavior in solution [24]. HA aggregation depends on a diversity of factors including pH, ionic strength, type and concentration of ions [25,26]. Because of this, the molar mass of HA molecules in solution is still a matter of debate [27]. A definition of HA molecular structure is essential for understanding the multi-faceted properties of these compounds and their behavior in the environment. HA have generally been assigned a macromolecular structure throughout the past century [28-32]. More recently, some authors [33-35] pointed to the lack of clear evidence supporting this view and described HA as supramolecular assemblies of molecules with a mass of about 600 g mol-1 [34]. Others [36] suggested that HA solutions consists of both small molecules and macromolecules. Notably, Baalousha et al. [37] reported that HA solutions mainly consist of supramolecular aggregates of relatively small molecules (20 nm diameter) and a minor fraction of isolated larger molecules (30-200 nm). Von Wandruszka [38] emphasized that the notion of HA solutions consisting of aggregates of small molecules was at odds with a part of the experimental evidence. Indeed, the possibility should be considered that HA samples from different sources, or extracted using different methods, have different molecular structures [39]. Thus, it is a good rule not to extrapolate the properties of a particular sample to the whole class of compounds. Recent work provided evidence that a commercial HA sample had a macromolecular structure [40]. This paper reports on the molecular structure of HA from compost investigated by treatment with organic acids, dialysis experiments and size-exclusion chromatography. Materials and Methods The compost was prepared by composting waste vegetables and fruits following the procedure reported elsewhere [41]. The extraction of humic acids from compost was carried out by basic/acid precipitation method following the procedure reported in [41]. Briefly, 90 g of compost were contacted with 1.0 L of distilled water and the pH was brought to 12.0 by solid NaOH for dissolving HA. Afterwards, the pH of the supernatant was brought to 1.5 by concentrated HCl and the precipitate (HA) was collected and stored. C, H and N composition was determined by a C, H, N analyzer (PerkinElmer 2400 Series II CHN/O Elemental Analyzer). Ash content was measured by heating the HA at 650 °C for 5 h. UV-Vis spectra were recorded on a Perkin Elmer, Lambda 40, spectrometer in a 0.20 mol L-1 NaHCO3 (pH = 8.6) solution, optical path = 0.50 cm. The effect of monocarboxylic acids on the HA structure was investigated by adding, drop by drop, pure acetic acid (>98%) or formic acid to 40 mL of HA solution (300 mg L-1, pH = 7.0), down to pH = 2.0. After about half an hour, a sediment started settling at the bottom of the vials. After one day, the precipitate was collected by centrifugation (3,000 rpm for 30 min), washed with deionized water, solubilized in 40 mL of 0.20 mol L-1 NaHCO3, and analyzed by UV-Vis spectroscopy. The supernatant obtained by centrifugation was evaporated by a roto-evaporator to eliminate the acetic or formic acid, and the resulting deposit was dissolved in 20 mL of 0.20 mol L-1 NaHCO3 and analyzed by UV-Vis spectroscopy. Dialysis experiments were performed as follows: 60 mL of HA solution, 300 mg L-1 in 0.20 mol L-1 NaHCO3, were introduced in a dialysis tube with a cut-off of 3.5 kDa or 5.6 kDa (Spectra/por, USA). The bag was put in contact with 60 mL of 0.20 mol L-1 NaHCO3, and the whole was periodically and gently shaken. LP-SECs were performed using Bio-Gel P30 Gel medium with 2.5 - 40 kDa fractional range (Bio-Rad Laboratories, USA), in a column 30 cm in length and 2.5 cm in diameter, eluted with 0.20 mol L-1 NaHCO3 (pH 8.6), flow rate 2.0 ml h-1. The eluate was analyzed by absorbance at λ = 450 nm and 280 nm. The void volume (Vo) and the total available volume (Vt) were measured by blue dextran (molecular weight = 2.0∙106 Da) and hydroquinone (molecular weight = 110 Da), respectively. The distribution coefficient (Kd) was computed from the relation Kd = (Vi-Vo)/(Vt-Vo), where Vi is the elution volume of the analyte i.
Results Characterization of HA sample
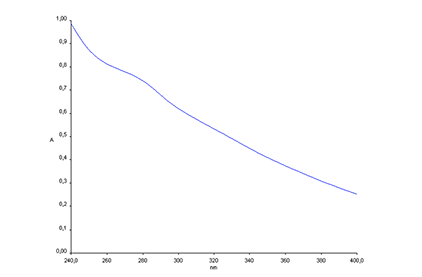
The shape of UV-Vis spectrum of HA (Figure 1) is characterized by a monotonical absorbance decrease with increasing wavelength, and by a shoulder between 265 and 295 nm prevalently due to aromatic rings. The molar absorption coefficient at 280 nm (e280) has been used as an index of the degree of aromaticity [42].
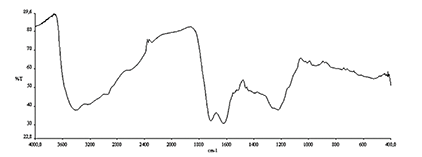
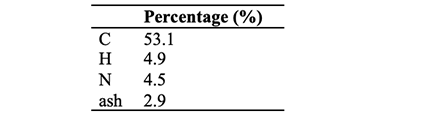
In line with results by Miikki et al. [43], the IR spectrum (Figure 2) displayed distinctive bands at ~ 1200 and 1700 cm-1 (carboxyl groups) and 1650 cm-1 (unsaturated C=C). The results of elemental analyses (Table 1) were in agreement with values previously reported for HA from compost [42]:
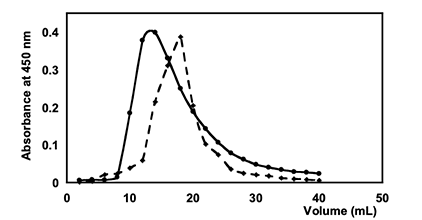
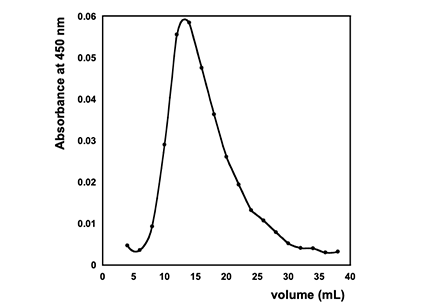
Monocarboxylic acid effects on HA structureThe UV-Vis spectrum of the precipitate obtained by acidification with formic or acetic acid was qualitatively and quantitatively indistinguishable, within the experimental error, from that obtained with the starting sample. The absorbance at 450 nm was about 90% of that of the starting solution. The amount of HA present in the supernatant resulted to be negligible. Membrane dialysis (MD) experiments HA in NaHCO3 solution was dialysed using membranes with cut-off of 3.5 kDa or 6 - 8 kDa. In either case, UV-Vis analysis did not reveal HA in the outside solution after three weeks. Size-exclusion chromatography (SEC) SEC has been commonly employed in work on humic acids [44,45]. The technique sorts the analytes according to their hydrodynamic volume, thus providing information on their molecular size as well as molar mass distribution for poly-dispersed materials. For macromolecules lacking a stable tridimensional structure, the molecular size can be strongly affected by the pH and ionic strength of the solution [34]. In this case, the elution volume depends on the specific eluent composition. Low-pressure SEC has the advantage, in comparison with high-pressure SEC, of permitting the collection of larger volumes of eluate, even with consecutive chromatographies. Figure 3 reports the low-pressure SEC chromatogram of the HA sample.
Figure 4 reports the chromatogram of compounds used for calibration. Hydroquinone was chosen as a model of low-molecular- weight humic acids [46]. Myoglobin, BSA and lysozime were chosen because of their sharply different isoelectric points (IP), with the aim to assess the effect of electrostatic interactions with the column. At the experimental pH (8.6), Myoglobin (IP = 7) and BSA (IP = 5) have a negative net charge whereas Lysozime (IP = 11) has a positive net charge. Figure 4 shows that the molar mass had a monotonic trend with the elution volumes, which suggests that column interactions played a negligible role. The HA chromatogram (Figure 3) is characterized by a broad peak, indicating a wide molecular weight distribution (or the presence of molecular aggregates with different sizes). The elution volume at the maximum height of HA peak nearly coincides with that of the globular protein bovine serum albumin (BSA, Figure 4), indicating the predominance in solution of particles with a hydrodynamic volume similar to that of BSA or larger. The molar mass of this protein is slightly higher than the upper value of the nominal fractional range. After this chromatographic run, the fraction corresponding to the eluate from the 18th to the 20th mL of the elution volume, was chromatographed again on the same column (Figure 3). As can be seen, the peak is sharper and more centered in correspondence to the elution volume of the fraction selected. Similar results were obtained with other fractions.
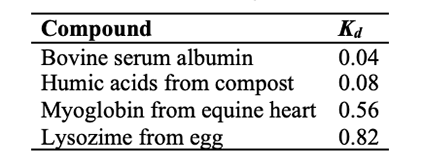
Interestingly, the chromatogram of a dilute solution of HA (Figure 5) closely mirrors the Table 2 reports the distribution coefficient (Kd) of our HA sample, computed in correspondence of the maximum absorbance, and of some proteins.
Discussion Piccolo and co-workers [47] reported that addition of monocarboxylic acids up to pH 2.0 to a HA solution caused disruption of the HA structure, producing molecules with low molar mass. In contrast, in our experiments the treatment with formic or acetic acid induced the almost complete precipitation of HA (in line with the well-known acid-base behavior of HA). Moreover, our MD experiments showed that HA molecules did not pass across dialysis membranes with a cut-off of 3.5 or 6-8 kDa. In the hypothesis that our HA sample were an aggregation of small molecules (equation 1), we should have observed the molecule M diffusing through the membrane up to equilibrium. The behavior actually observed was that expected for macromolecules not for aggregates of small molecules. The size-exclusion chromatograms recorded using a gel with 2.5 - 40 kDa fractional range, led to the same conclusion. Independently of HA concentration, the results indicated a broad molar mass distribution with a prevalence of molecules with a mass close to the upper limit of the fraction range used. Second-run chromatograms of eluate fractions gave sharper peaks, indicating that the starting HA sample was a mixture of macromolecules of different sizes. The property of HA to charge negatively in solution at neutral and basic pH does certainly not favor molecular association and, were this to occur, the forces involved should be weak. Because of this, the association of small, heterogeneous molecules should have a relatively small variation of the standard Gibbs energy (ArG°), a relatively small association equilibrium constant, and a relatively high rate constant [48]. Thus, the hypothesis that our HA sample were an aggregate of small molecules may be excluded.Conclusions The experimental data reported in this paper unambiguously show that the HA analyzed have a macromolecular structure with a broad molar mass distribution and a prevalence of molecules with a hydrodynamic volume close to that of the globular protein bovine serum albumin (molecular weight = 66.5 kDa). Our approach requires simple equipment available in any chemical laboratory and may thus become a reference procedure for testing the chemical structure of HA samples of any origin. Data Availability Data are available on request (please contact the corresponding author). Conflicts of Interest “The authors declare that there is no conflict of interest regarding the publication of this paper.” Funding Statement This research received no external funding. Acknowledgements The authors are grateful to Prof. Roberto Ligrone for very useful discussion of results. References
|
|||||||||||||||||||||||||||||||||