|
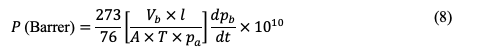
Introduction Polymeric membranes have been commercialized for gas separation since the 1980s [1]. The first application was for the removal of hydrogen from methane by a polysulfone membrane [2]. The applications were then expanded to cover acid gas removal, and oxygen enrichment [3]. The membrane is considered as an environmentally-friendly technology because it operates at low energy and it does not produce toxic wastes [4]. Furthermore, the membrane is easy to scale up and can have a continuous life of five years [5,6]. There are many materials for polymeric membranes and their performance varies broadly depending on the polymer and the gases to be separated. The widely accepted theory for gas transport through dense polymeric membranes is the solution-diffusion model [7]. The model states that the gas is first absorbed on the membrane surface and then dissolved. The gas then diffuses inside the membrane by a means of free volumes. The gas is then desorbed on the low-pressure side. Their dominant factors that control the solution-diffusion model are solubility and diffusivity [8]. The permeability (P), which is one of the key parameters to describe the membrane performance, is the product of solubility and diffusivity: where Ki and Di are the sorption and diffusion coefficients of gas a, respectively. The permeability gives information about the quantity of the produced gas (also known as the permeate). Experimentally, the perme-ability can be determined without the need for solubility and diffusivity measurements. There are typically three approaches to measure the permeability: using a bubble flowmeter, a mass flowmeter, and the time-lag technique. Each method will be discussed in detail in the following sections. The permeability data is given in Barrer (named after Richard Barrer) and it is calculated by: where VA is the volume flowrate of the permeate of gas a (cm3 s-1), l is the membrane thickness (cm), A is the active membrane area (cm2), and ∆P is the pressure difference across the membrane (cmHg). The mentioned techniques for permeability calculations actually measure the volume flowrate which will be used to calculate the permeability as given in equation 2. Because the volume of the gas depends on the pres-sure and temperature, the volume flowrate for equation 2 should be stated at STP (standard temperature and pressure of 0°C and 1 atm). STP should not be confused with NTP (normal temperature and pressure) where the temperature is 20°C instead of 0°C. The pressure in NTP is 1 atm which is very close to 1 bar (0.986 atm). Assuming ideal gas behavior, the volume flowrate can be converted from NTP to STP using the following equation: where TSTP and TNTP , are the temperatures of 273 and 293K, respectively. This gives a correction factor of 0.925 when the flowrate is converted of NTP to STP. The membrane thickness in equation 2 is commonly determined using a caliper in the case of a symmetric membrane which is made from a single material with a uniform structure (porous or dense). However, for asymmetric membranes made from two or more materials (composite), characterization techniques such as scanning electron microscopy (SEM) are needed to measure the thickness of the selective material which is usually the dense layer. Other techniques such as transmission electron microscopy (TEM) and atomic force microscopy (AFM) can be used as well [9]. It is worth mentioning that asymmetric membranes can be made as well from a single material using the phase-inversion method [10].
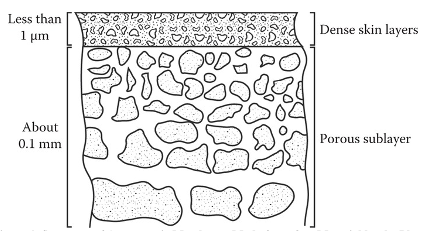
The developed membrane will have two structures: porous and dense, as given in Figure 1, despite the use of one material. In this case, the membrane thickness is the skin of the dense layer similar to the composite membrane [11]. In literature, most of the membranes are made from the phase-inversion method and therefore, a spectro-scopy technique is needed to measure the membrane thickness.
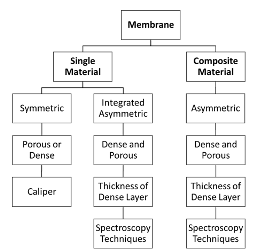
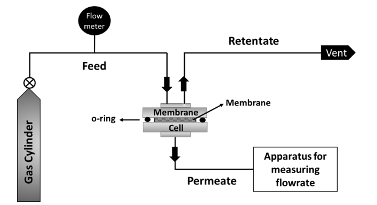
Figure 2 gives general guidelines for determining the membrane thickness for calculating the permeability in Barrer. Some-times is it difficult to measure the membrane thickness as it can vary notably along with the membrane structure. Furthermore, the spectroscopy technique maybe not available to measure the membrane thickness. Thus, a new unit for gas permeability was defined and it is known as permeance (Q). It is calculated similar to equation 2 but without the use of thickness: where VA, A, and ∆P shares the same units as equation 2. The unit of permeance is the gas permeation unit (GPU). Unfortunately, the units of Barrer and GPU cannot be converted if the membrane thickness was not stated. If the membrane thickness is known, the following equation can be used to convert the permeability from Barrer to GPU.It should be noted that Barrer is considered as a more accurate unit than GPU for stating the permeability as it takes into consideration the membrane thickness. This will make the comparison with other reported data more reliable for the same membrane. However, industrially, the membrane performance is widely described by GPU unit rather than Barrer for easier calculations. This paper reviews the methods for measuring the permeability in polymeric membranes using different approaches such as bubble flowmeter, mass flowmeter, and the time-lag method (also known as the closed volume technique). The paper also describes about calculations of solubility and diffusion coefficients. Furthermore, the paper discusses the determination of gas selectivity which represents the purity of the gas produced. The paper also differentiates between the ideal and real selectivities and the latter is a key parameter for determining the membrane performance for commercial applications. The calculations of product purity and gas recovery are also important to evaluate the membranes with other separation technologies such as the amine process. Permeability Measurements The permeability can be calculated based on the measured flowrate of the permeate. There are extensively three ways to measure membrane permeability: (1) bubble flowmeter, (2) mass flowmeter, and (3) time-lag technique. Before starting the evaluation, the membrane should be examined visually. Any visible holes or defects may cause incorrect value of the permeability. The membrane is then inserted in a cell, usually made of metal housing. Rubber rings (with o-shape) are traditionally employed to seal the membrane and prevent gas leakage. The gas is normally fed to the membrane by a gas cylinder equipped with a pressure regulator. A mass flow controller (MFC) is commonly used to control the feed flowrate. This device is used to set the volume flowrate of the feed gas. The output gas (after MFC) will be at atmospheric pressure and a pressure control valve can be employed to elevate the pressure. The feed gas will reach the membrane surface and the volume flowrate of the permeate will be measured to deter-mine the permeability. Figure 3 shows the common experimental setup for the permeability test.
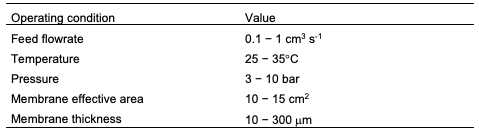
It should be noted that there are some inputs that should be defined before performing the membrane assessment. These inputs will significantly affect the permeability data. The parameters are the gas feed flowrate, temperature, pressure, membrane area, and membrane thickness. The area is calculated based on the cross-section area of the membrane as follows: where d is the diameter of the exposed area to the gas which is usually lower than the total diameter of the membrane as the o-rings will block some region for sealing. Unfortunately, there are no standards for the input parameters, however, the following values are widely used in literature: feed flowrate of 0.1−1 cm3 s-1, temperature of 25−35°C, pressure of 3 −10 bar, area of 10−15 cm2, membrane thickness of 10−300 mm as given in Table 1. The following sections will discuss the methods for deter-mining the permeability using the bubble flowmeter, mass flowmeter, and the time-lag technique.
Bubble Flowmeter
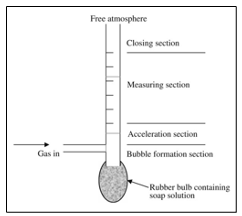
It should be noted that not all gases can be used in the bubble flowmeter. For example, high water-soluble gases such as ammonia and hydrogen chloride will be dissolved in the soap solution, and this will cause a significant error in the reading [30].
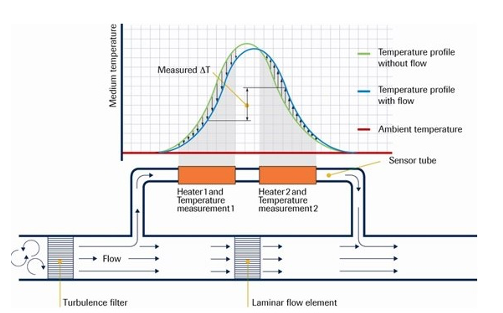
Mass Flowmeter
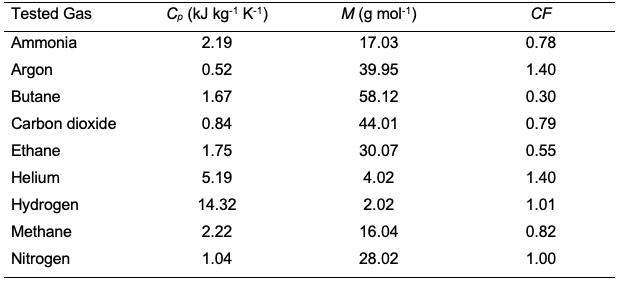
It should be noted that the mass flowmeter is calibrated for specific gas and its accuracy is within ±1% [32]. However, using the same mass flowmeter for a different gas than the calibrated one may introduce an error in the measurement. For example, a calibrated mass flowmeter for nitrogen was tested for methane and the error reached 20.5% [33]. Yet, when the same mass flowmeter was used for hydrogen, the error was only 1%. It was found that the error depends highly on the specific heat of the gas which is defined as the required energy to raise the gas temperature by 1 K of a unit mass of gas at constant pressure (Cp). Table 2 shows the calculated correction factor (CF) for a nitrogen-calibrated mass flowmeter tested with other gases. The correction factor was calculated using the following equation: where B is the tested gas and A is the calibrated gas. M is the molecular weight and Cp is the specific heat at constant pressure. So, if the mass flowmeter is calibrated with methane, and butane is to be used, equation 7 will give a correction factor of 0.37. The absolute average error of the previous equation is 3.1%. The data in some mass flowmeters are given in NTP while the others are given in STP. To calculate the permeability in Barrer or GPU, the data of volume flowrate should be converted to STP using equation 3. The mass flowmeters are capable of reading flows from 0.0003 to 40,000 cm3 s-1 [34]. Furthermore, the technique can be used to monitor the membrane permeability for long-term operation.
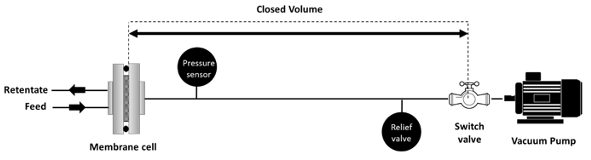
Time-Lag Method The time-lag method is based on a closed volume in which the permeate flowrate will cause an increase in the pressure with time. The volume of the closed system should be accurately determined taking into consideration the volume of pipes. Before the experiment, the system is vacuumed using a pump and a pressure gauge is utilized to monitor the pressure. The system should be leak-free otherwise, the permeability data will be incorrect. To make sure the setup is gas-tight, the system is kept under vacuum (with no gas fed) for about 24 h. First, the vacuum pump should be run for about 30 min, and then the valve before the pump is closed. Generally, the pressure gauge should give a reading below 3 mbar for the system to be considered gas-tight. Figure 6 shows the setup for the time-lag experiment.
After feeding the gas to the membrane, the permeated gas will cause a pressure buildup. The experiment is usually terminated when the pressure reaches 1 atm. Gauge-pressure data should be monitored along with the time on stream. The time starts at 0 s when the gas is fed to the membrane. The permeability (in Barrer) can be then calculated using [37 ]:
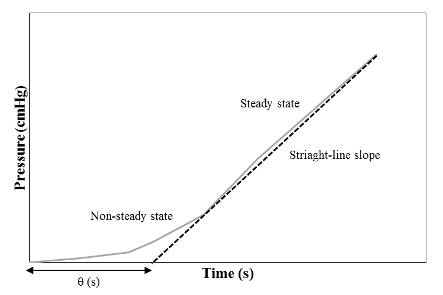
where Vb is the volume of the closed system (cm3), T is the temperature (K), Pa is the pressure of the feed gas (cmHg), and dpb /dt is the rate of change of the pressure in the permeate side with time (cmHg s-1). The plot of the pressure in the permeate side along with time will give a straight-run and the slope is equal to as given in Figure 7.
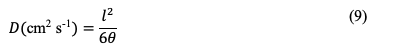
For the first time of operation, it is expected to observe a non-steady-state line. After a certain time, a steady-state process is achieved and a straight slope line will be noticed which will be used to calculate dpb /dt. The time-lag method is beneficial over the bubble and mass flowmeters for very low permeate flowrates. Furthermore, the time-lag technique can be used to determine the diffusivity (or diffusion coefficient, D) by the following correlation [16]:
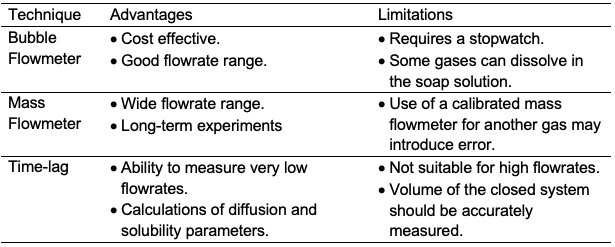
where l is the membrane thickness (cm) and ⍬ is the time lag (s). The time lag is calculated based on the intercept of dpb /dt line as shown in Figure 7. The solubility (K) can be then calculated from equation 1: where P is the permeability and D is the diffusion coefficient. The accuracy of the time-lag method can vary from 3 to 27% for permeability and diffusion/solubility coefficients [39]. Table 3 shows the advantages and limitations of bubble flowmeter, mass flowmeter, and the time-lag method for membrane permeability measurements.
Selectivity Calculations To study the membrane performance, the membrane should be tested with at least two gases. This is because the membrane defects (such as voids and cracks) may result in an increase in the membrane permeability as there will be no flow resistance. This can be reflected if the selectivity is very low or nearly 1. Usually, the permeability of gas a will be measured separately and then the permeability of gas b will be measured. Dividing the two permeabilities of gas a and b will give the ideal selectivity (aAB):
where PA is the permeability of gas a (the desired gas) and PB is the permeability of gas b (the unwanted gas). Another way to calculate the selectivity is by introducing two or more gases at the same time. The user should define the gas mixture composition which is usually 50 vol% of gas a and 50 vol% of gas b. Because the permeate will have two or more gases, the produced gas should be analyzed to determine the composition so the flowrate of each gas can be calculated. This is necessary so that the permeability of each gas can be determined. Usually, a gas-chromatography (GC) is used for this purpose but other instruments such as mass spectrometers, infrared analyzers, and colorimetric tubes can be implemented as well. After determining the volume percentage (vol%) of each gas, the volume flowrate of each gas in the permeate can be quantified by:
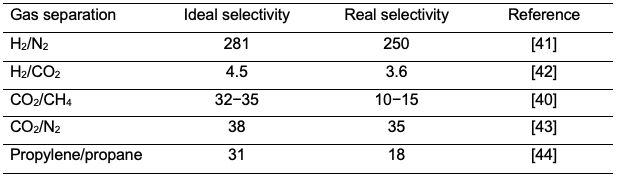
where Vp is the volume flowrate of the total gas in the permeate, (Vp )A is the volume flowrate of the product gas a and (Vp )B is volume flowrate of gas b. The real selectivity can be then calculated using equation 11. Industrially, real selectivity is a must as it gives the actual membrane performance. The real selectivity can significantly change when mixtures are introduced compared to the ideal selectivity. For example, a cellulose acetate membrane was used for carbon dioxide separation from methane and the ideal selectivity was greatly reduced from 35 to 15 when a gas mixture was used [40]. It was also found that the real selectivity is a function of the composition of the mixture gas. Therefore, the ideal selectivity should be only used for research purposes and the real selectivity should be measured using actual feeds. Table 4 shows that the real selectivity is always lower than the ideal selectivity. Generally, the real selectivity is reduced by 10 to 63% compared to the ideal selectivity.
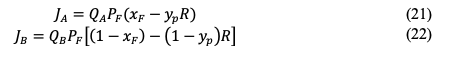
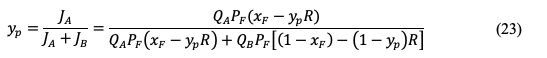
Calculations of Gas Recovery and Product Purity In literature, the membrane performance is described by permeability and selectivity and these parameters are advantageous in comparing the membrane with other reported data. Furthermore, permeability and selectivity are useful for membrane modeling and upscaling. However, to evaluate the membrane system with other gas-separation technologies such as amine scrubber and pressure swing adsorption (PSA), universal terms are preferred such as gas recovery and product purity. The following equation can be used then to calculate the gas recovery (R): where (Vp )A is the volume flowrate of gas a in the permeate and (VF )A is the volume flowrate of the gas a in the feed. Normally, a commercial membrane is expected to have a recovery of 70 to 99%, depending on the separated gas [45]. For the product purity, mixed-gas experiments should be conducted and GC will determine the mol% of component a in the permeate. It should be noted that the gas recovery and product purity greatly depend on the operating conditions such as feed composition, feed flowrate, pressure, temperature, and membrane area. Product purity of a binary system can be still estimated from the data of ideal selectivity [46]. Mole balance across the membrane is applied by the following equation (neglecting accumulation): where n is the number of moles, xF is the mole fraction of component a in the feed, xR is the mole fraction in the retentate, and yP is the mole fraction in the product. Equation 15 can be rewritten as: where Q is the permeance, A is the membrane area, and the last term is the trans-membrane pressure difference. PF is the feed pressure while PP is the permeate pressure. The transmembrane pressure difference can be simplified to (assuming complete mixing, neglecting radial gradients, constant pressures, and no mass-transfer resistance): The flux of component a (JA) can be calculated by combining equations 16 and 17: where QA, xF, and yP are properties of component a. For component b, the flux is: The ratio of absolute pressures (R) is defined as:
The mole fraction of component a in the permeate can be estimated by:
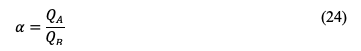
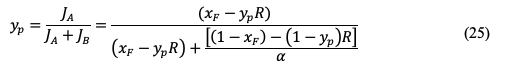
Use of ideal selectivity in equation 11 but in terms of permeances gives:
Applying the previous equation in equation 23 leads to:
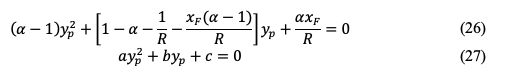
The above equation can be rearranged resulting in a quadratic equation:
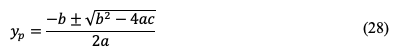
The solution for equation 27 is:
So, to calculate the product purity for a binary system, the following data are needed: feed and permeate pressures, feed composition, and ideal selectivity value. Conclusions The membrane is an energy-efficient technology for gas separation. It requires minimum supervision and has a long operating life. The membrane performance is determined by measuring the gas permeability and selectivity. However, the data can change significantly based on the experimental setup. Permeability is defined as the product of solubility and diffusivity, and it can be calculated based on measuring the flowrate of the permeate. The user should define the operating conditions before performing the experiment, which generally are: feed flowrate of 0.1−1 cm3 s-1, temperature of 25−35°C, pressure of 3−10 bar, membrane effective area of 10−15 cm2, and membrane thickness of 10 −300 mm. There are mainly three ways to measure the permeate flowrate: bubble flowmeter, mass flowmeter, and time-lag method. The bubble flowmeter provides a low-cost solution for flowrates ranging from 0.1 to 1000 cm3 s-1. The mass flowmeters are generally more accurate than the bubble flowmeters with a wider flow range. The time-lag method is useful for low flowrates, and it can be also used to determine the solubility and diffusion coefficients. The membrane should be tested for two or more gases to calculate the selectivity. If the gases were fed separately, this would give the ideal selectivity. However, for commercial appli-cations, the mixed gas should be fed directly to the membrane and a gas chromatograph has to be used to determine the composition of the permeate. After that, the real selectivity can be stated. The real selectivity could vary significantly from the ideal selectivity, and this would seriously affect the membrane performance. To evaluate the membrane unit with other separation techniques, common terms are usually preferred such as gas recovery and product purity.
Funding This research received no external funding.
Conflict of Interest The authors declare no conflict of interest.
References
|
|||||||||||||||||||||||||||||||||||||||||||||||||||||||||||||||||